User Interface
A video describing the user interface is available; to watch it, click the blue video icon below (Internet connection required).

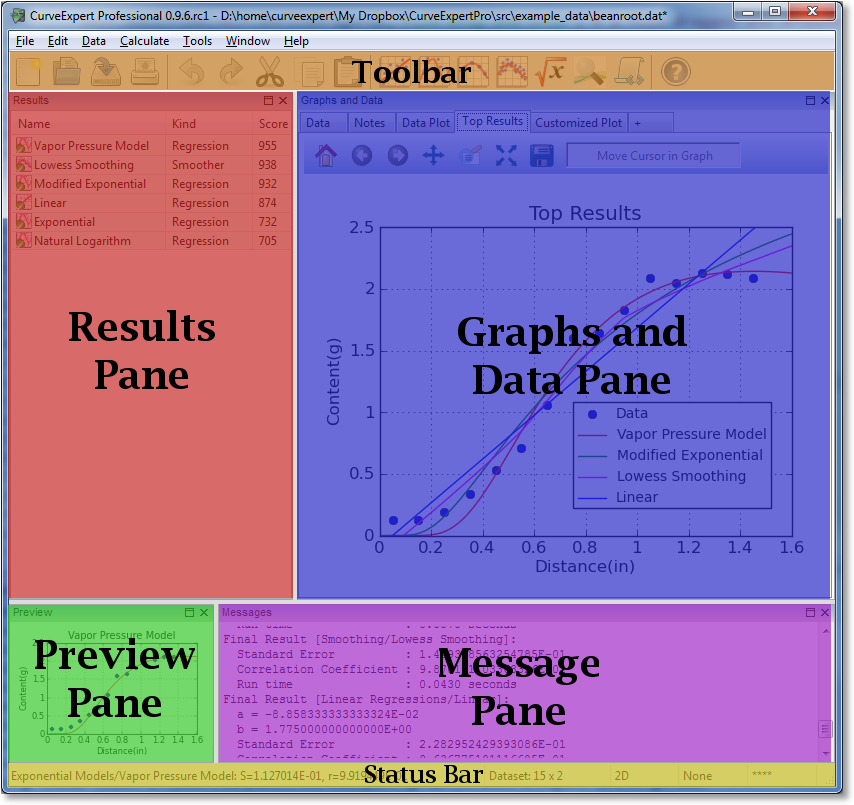
The CurveExpert Professional user interface is divided into panes:
Results
Graphs and Data
Preview
Messages
The panes, as well as the toolbar and status bar, are labeled in the graphic below:
All of the panes can be shown or hidden via the Window menu in the menu bar. Further, panes (except for the Graphs and Data pane) can be torn out from the main window; grab the pane by its title bar, and tear it out. The panes can be redocked in the main window by the reverse operation; drag the window to one of the docking indicators, and a transparent hint will appear to show where the window will be docked. Using this procedure, the panes can be rearranged inside the main window to taste.
Panes can be quickly maximized by clicking the small box at the top right of each pane; this allows the pane to fill the entire main window. Restoring the size of the pane can be performed by clicking the double-box at the top-right of the pane. This gives a quick means of viewing a particular pane (most commonly the Graphs and Data pane) in full size.
All panes can be hidden by clicking the ‘X’ at the top right of the pane, or by deselecting the corresponding pane name in the Window menu. To show a pane after being hidden, select the corresponding pane name in the Window menu.
Toolbar
The toolbar can be shown or hidden via “Window->Toolbar”.

Each button on the toolbar has a one-to-one mapping to an item in the menus. The toolbar is divided up into the following sections:
File
Edit
Calculate
Tools
Help
The buttons are each documented below.
Icon |
Meaning |
|---|---|
|
File->New. Reinitializes the application with an empty dataset and no results. When New is selected, you must input the desired number of columns in the new dataset. |
|
File->Open. Opens a new (text) data file or CurveExpert file. |
|
File->Save. Save the current data, results, graphs, and notes into a CurveExpert file. |
|
File->Print. Prints the contents of the spreadsheet as a data table. If you would like to print all graphs, hold SHIFT while selecting File->Print. |
|
Edit->Undo. Undo the last appropriate action. |
|
Edit->Redo. Redo the last appropriate undone action. |
|
Edit->Cut. Cuts the selected item(s) to the clipboard as appropriate. |
|
Edit->Copy. Copies the selected item(s) to the clipboard as appropriate. |
|
Edit->Paste. Pastes data from the clipboard as appropriate. |
|
Calculate->Linear. Calculates a straight line regression for the data. |
|
Calculate->Nonlinear Model Fit. Shows the nonlinear regression picker so that you can select a model or models to compute. |
|
Calculate->Cubic Spline. Calculates a cubic spline for the data. |
|
Calculate->Lowess Smoothing. Immediately calculates a Lowess smoothing of the data. |
|
Calculate->Function. Shows the function picker so that you can select a function or functions to compute. |
|
Tools->CurveFinder. Runs the CurveFinder to scan models for the best fit for your data |
|
Tools->Custom Models(Simple). Opens the custom model creator (simple interface) |
|
Help->Manual. Opens the documentation. |


Results Pane
The results pane displays a list of the currently calculated results. This list is color-coded and badge-coded; see Working with Results for an explanation of the color codes and badges.
The items displayed in the columns of the results pane can be customized by right-clicking the column headers. The following items may be selected for display:
Name (required; cannot be deactivated)
Kind
Family
Score
R (correlation coefficient)
R^2 (coefficient of determination)
Std_Err (standard error)
Remember that you can send results to a plot, remove a result, or view result details by right-clicking a particular result. See Working with Results for details.
Graphs and Data Pane
The “Graphs and Data” pane is a notebook where the dataset and graphs reside (as well as any notes that you would like to save). reside. Please refer to The spreadsheet for information on how to work with the dataset via the built-in spreadsheet. Refer to Graphing for documentation concerning how to work with graphs.
Two graphs are always present: “Data Plot” and “Top Results”. As the name implies, the
Data Plot always displays your raw data with no other results. Top Results displays
the top  results from the set of calculations that the user has run; is
configurable via Edit->Preferences->Graphing->Automatically plot top n results.
results from the set of calculations that the user has run; is
configurable via Edit->Preferences->Graphing->Automatically plot top n results.
To add another graph, simply press the “+” tab; this adds another graph for you to build as you see fit. You may also rename any of your custom plots by right-clicking on the tab and selecting Rename; this assists in keeping track of multiple graphs. Also, you can delete a graph entirely by right-clicking the graph tab and selecting Delete. Finally, you can copy (clone) a graph by right-clicking the appropriate graph’s tab and selecting Clone.
Your notebook can also be rearranged to taste. Select one of the notebook pages (by clicking on it), and then hold the shift key along with a left or right arrow key to move the selected notebook page left or right, respectively. Using the left/right arrow keys without holding shift simply selects the page to the left or right, respectively.
Remember that, for a graph that you have created, you can drag and drop results from the results pane to plot any results of interest.
Preview Pane
The preview pane displays the result that is pointed to in the Result pane, or, if a result is pointed to in a graph, the preview pane also updates to the pointed-to-result. While convenient, the preview window can cause the user interface to be sluggish on older computers; to disable the preview, simply hide it by deselecting Window->Preview, or more straightforwardly, click the ‘X’ at the top right of the preview pane.
Messages Pane
The Messages Pane is an area where CurveExpert Professional sends all notifications for your perusal. For example, when a file is read, the a summary of the file contents appears in the Messages pane. Also, when any calculation is undertaken, a summary of the result appears in the Messages pane.
The content of the messages pane can be copied and pasted to another application by highlighting a portion, right-clicking, and selecting Copy, or by using Ctrl+C (on a Mac, Cmd+C).
Error messages appear in the Messages pane in red, and special messages appear in blue. All messages that appear in the Message pane are automatically logged, and be accessed after-the-fact via Tools->Log Viewer (see Log Viewer).
Status bar

The status bar is divided into five sections, which show the following items:
Section |
Displays |
|---|---|
1 |
typically shows vital statistics for the currently pointed-to result, or displays help when appropriate. |
2 |
size of the currrent dataset (nrows x ncolumns) |
3 |
dimension of the dataset, which determines the mode of the application |
4 |
current locale |
5 |
number of helper processes present that perform calculations (see Max number of cores to utilize). Each asterisk represents one helper process. |