Application Preferences
Introduction
Application preferences can be changed by choosing Edit->Preferences from the menu.
General Preferences
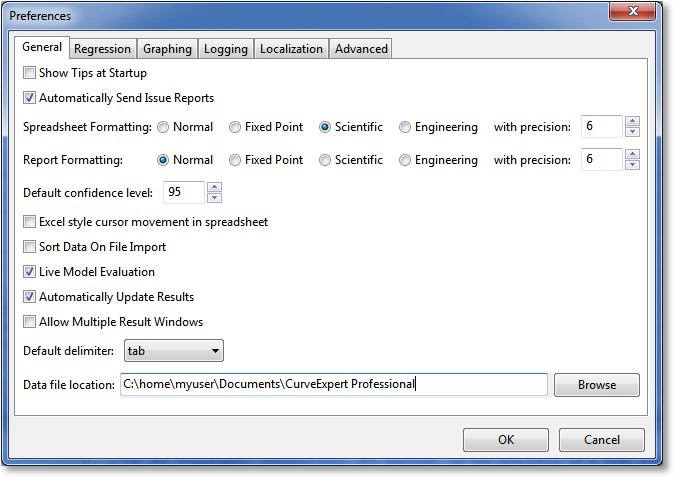
General settings apply to general items of interest in CurveExpert Professional.
Show Tips at Startup
When the software starts, a helpful tip can be shown. However, if you find this either unhelpful or annoying, it may be turned off (or back on) by selecting this checkbox.
Automatically send issue reports
CurveExpert Professional has the ability to automatically send an issue report should something go wrong with the software. The objective of doing is to find and correct problems in the most timely manner possible.
An issue report, when and if one is sent, contains no personally identifying information or any of your data, and the report itself is submitted anonymously. However, if you would like to opt-out of this behavior, uncheck this box.
Spreadsheet Formatting
The spreadsheet formatting setting allows you to set your preference for how data is displayed, by default, in the spreadsheet. The data may be displayed in a fixed point, scientific, or engineering format, with a precision (number of digits after the decimal) as specified in the with precision field. This default number formatting can always be overridden on a per-cell basis by selecting the cells in the spreadsheet, right clicking, and selecting Format Numbers as documented in Number Formatting.
The engineering format is the same as scientific, except that the exponent is always a multiple of three.
Report Formatting
CurveExpert Professional displays formatted reports for things such as the result details and comparing regressions. When displaying numerical data in these reports, a particular formatting must be used for this data. The style can be chosen in this application preference.
The data may be displayed in a fixed point, scientific, or engineering format, with a precision (number of digits after the decimal) as specified in the with precision field.
The engineering format is the same as scientific, except that the exponent is always a multiple of three.
Note that this option is just a default, and you will be given the chance to change the formatting when the report is generated.
Default confidence level
In result details and in displaying confidence/prediction bands, a certain confidence level is needed. The default confidence level set in the preferences here is the starting level set throughout the application in these situations. You will be given the opportunity to change the confidence level on a result-by-result basis.
Excel style cursor movement in spreadsheet
By default, both the TAB and ENTER keys are treated as carraige returns in CurveExpert Professional. In other words, the cursor is moved to the left until it bumps into the right side of the dataset, in which case the cursor is moved to the beginning of the next row.
If you would rather that the cursor go right on a TAB (which is the same as the default TAB behavior), and down on an ENTER, select this box. Note that CurveExpert Professional will still keep your cursor within the bounds of the dataset.
Sort Data On File Import
Normally, CurveExpert Professional reads your data directly from file, accounts for the settings in the File Import window while importing, and places it in the spreadsheet. If you would also like to automatically sort the data against the first column, check this box.
This capability is most useful if you frequently use splines to fit data; the data must be sorted for a spline to compute correctly.
Live Model Evaluation
In the result details window, an evaluator follows the location of your mouse to inform you of the x/y location of the mouse, the model/function evaluated at the pointed-to x coordinate, and the first derivative of the model/function. If this is not desired or is too slow, uncheck this box.
There also an intermediate state for this checkbox; if set to intermediate, the live evaluator will activate when the left mouse button is pressed only (by default).
Automatically Update Results
If you have already calculated results and then change the data, the results become invalid (see Working with Results). This state is indicated by a yellow caution badge placed on the results in the Results pane. To update these results, you can select some (or all), right click, and select Update. To automatically update results without having to do it yourself, check this box. As soon as a change in the data is detected, all results will be recomputed.
Allow Multiple Result Windows
Allow the opening of multiple result windows at one time, instead of allowing only one. While convenient, it can lead to a window management problem if you open too many at once.
Note
This feature is disabled on OSX (Mac) platforms.
Default delimiter
In several places in the software, a delimiter is used to separate items in the same row. For example, in copying data to the clipoboard, or in generating a table, a delimiter between data items must be selected. If you have a favorite delimiter, set it here.
Data file location
Default directory where data files are stored. Initially, the data file location is set to $DOCUMENTS/CurveExpert Professional, and some example data and example documents are placed there at install time.
Regression Preferences
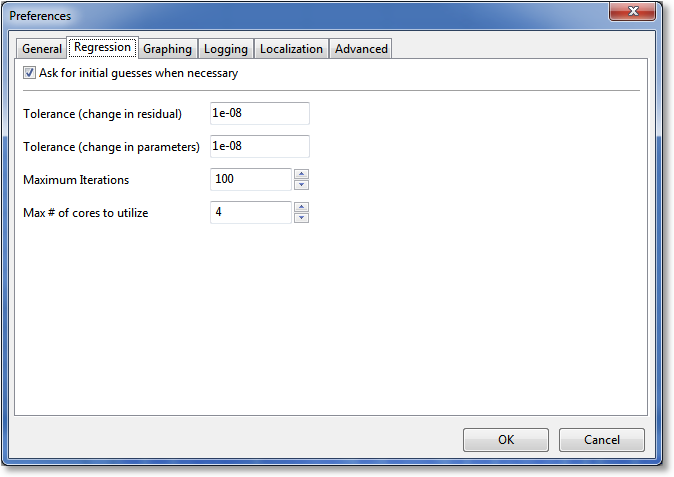
Ask for initial guesses when necessary
At times, when calculating a list of nonlinear regressions at once, the calculation of the initial guess will fail for some (for various numerical reasons; a simple example is when the natural log is taken in the process of calculating the initial conditions, and there is a zero or negative in the dataset). When this happens, CurveExpert Professional will prompt you to ask if you want to attempt initial guesses manually, and give a list of the fits that failed in this manner.
If you want CurveExpert Professional to just treat initial guess failures as general model failures, uncheck this box.
Tolerances
The tolerances determine when CurveExpert Professional will stop calculating a given model; in any nonlinear regression, the solution is an iterative process in which the model parameters are adjusted in order to reach the best possible set. The iteration will terminate when either the overall change in the residual is below the given tolerance, or when the change in the parameters is below the given tolerance. The residual is defined as

Maximum Iterations
The iteration described in “Tolerances” above can also be terminated when the number of iterations reaches a certain threshhold. That threshhold is specified in this field.
Max number of cores to utilize
CurveExpert Professional can make use of multiple cores on your system when computing batches of nonlinear regressions at a time. The number of cores to utilize can be specified here.
Note
If you only compute one nonlinear regression at a time, and not batches of them, it is best to just leave the multicore setting at zero.
Note
A multicore setting of zero is different than one. Zero signifies that computations take place in the same process as the GUI, and one means that there is one worker process present (which consumes memory) in which the computations are performed.
Graphing Preferences
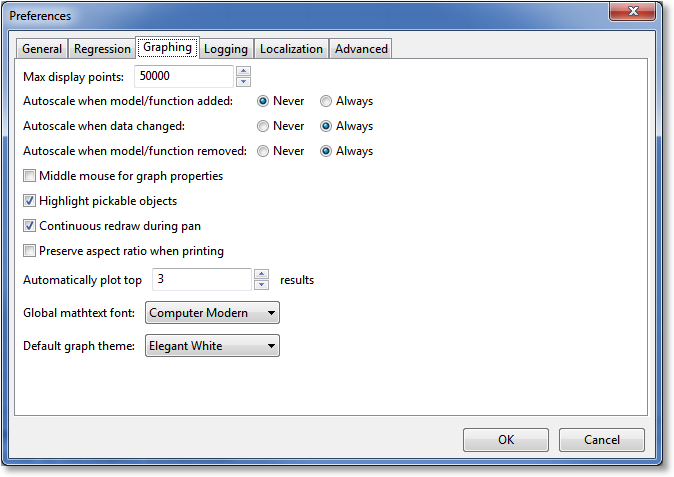
Max display points
Sets the maximum number of points, per series, to display when drawing a discrete dataset on a graph. If the dataset has more points than this, it will be thinned to this number of points. The thinning is based on an appropriate stride to use in order to reduce the total number of points drawn to below the threshhold given here. This option is in place to prevent extremely slow graph redraws due to attempting to draw an excessive number of points.
This option affects discrete datasets only; not continuous functions. For continuous functions, the Resolution parameter, in the Series Page of the Graph Properties dialog (see Changing Graph Properties), is the way to control the sampling of the function that is used for drawing.
Autoscale when model/function added
When a model or function is added to a graph (via a Send to Plot command or a drag and drop), CurveExpert Professional can automatically autoscale the graph. In this case, you can set the preference to “Never” or “Always”. If the autoscale lock has been set for a graph (see Graph Toolbar), the graph will not be autoscaled regardless of this setting; in other words, the graph’s autoscale lock takes precedence over this preference.
Autoscale when data changed
In order to keep the data in view at all times in all graphs, CurveExpert Professional can automatically autoscale the graphs when the underlying dataset changes. The disadvantage of doing this is that, for large datasets, the redraw can be slow. Also, if you have specified your own limits to axes in the graphs, they would be lost if the data changes. If the autoscale lock has been set for a graph (see Graph Toolbar), the graph will not be autoscaled regardless of this setting; in other words, the graph’s autoscale lock takes precedence over this preference.
To control when autoscaling takes place, select either “Never” or “Always”.
Autoscale when model/function removed
When a model or function is removed from a graph (either by removing the result from your document altogether, or by right clicking a result on a plot and selecting “Remove”), CurveExpert Professional can automatically autoscale the graph. In this case, you can set the preference to “Never” or “Always”. If the autoscale lock has been set for a graph (see Graph Toolbar), the graph will not be autoscaled regardless of this setting; in other words, the graph’s autoscale lock takes precedence over this preference.
Middle mouse button for graph properties
Normally, the right mouse button is used to access the context menu on graphs. However, for mouse rotation of 3D graphs, it is sometimes more intuitive to use the right button for that purpose. So, you can set the middle mouse to be the graph context menu activator if desired.
For 2D plots, this setting has no effect. The graph context menu can always be accessed with either a middle or right click of the mouse.
Highlight pickable objects
As you move the mouse over a curve or data, it will highlight, signifying that you can click it to modify its properties. Also, it signifies that, on right-click, you can access the details for that series. However, the redrawing necessary for this feature can make the graph response sluggish. So, deactivate this feature if you don’t need to see the highlighting or access details directly from the graph.
Continuous redraw during pan
During a pan, all continuous series must be regenerated on-the-fly if this feature is turned on. This can be expensive, so if it is OK not to see the curve dynamically update during a pan, turn this checkbox off. The series will then only be regenerated each time the mouse button is released during a panning operation.
As a reminder, this setting does not affect discrete datasets on the graph; only results that are continuous.
Automatically plot top # results
When computing batches of nonlinear regressions at once, if all of them were plotted on the “Top Results” graph, it would be quite messy. Here, you can decide how many of the results will be plotted on the graph for each batch that you compute. The default behavior is to take the best three fits for every batch that you compute. Other results that you want to visualize can always be added by right clicking them and selecting Send to Plot, or by dragging and dropping the result to the plot.
Preserve aspect ratio when printing
Normally, any graph is fit to the page when it is printed. If you would like to preserve the aspect ratio of your graph when printing, check this box. In other words, if you have a graph that is long and skinny, to keep it long and skinny when printed, check this box.
Global mathtext font
The font used to render equations (see Mathtext) through the application can be set to Computer Modern, STIX Serif, or STIX Sans-serif. Computer Modern looks very much like TeX equations. STIX Serif looks slightly different, and is meant to blend with surrounding text that is serifed (such as Times Roman). STIX Sans-serif is obviously a non-serifed font, meant to blend with surrounding text that is nonserifed (such as Helvetica or Arial).
Default graph theme
A graph theme is the “look” of the graph, and new themes can be constructed either with the graph theme manager (Tools->Manage Graph Themes) or by saving a theme directly from a graph by right-clicking and selecting Save Theme. Every graph has a default theme, and you can set what that default theme is here. This way, all plots will be constructed with the look that you desire.
Logging Preferences
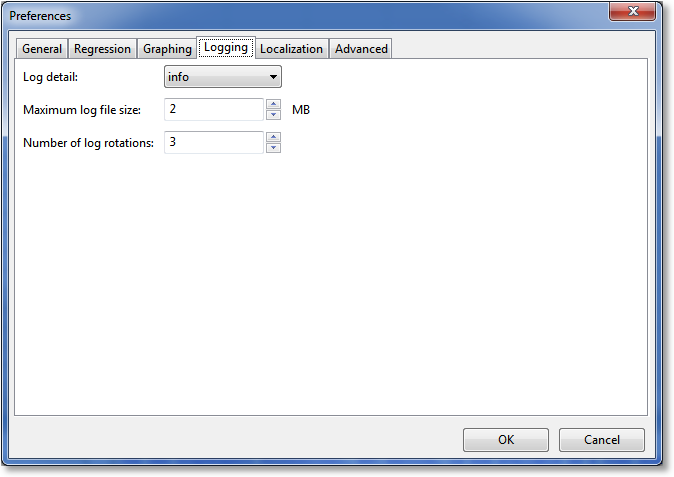
Log detail
CurveExpert Professional keeps a log in $HOME/.curveexpert/logs (see Log Viewer) ; the log detail setting determines the detail of messages that are stored in the log. The default setting is “info”, which logs all messages that appear in the message window, as well as internal information generated by the application. To have less information logged, move the log detail setting to warning, error, or critical. To log more (for example, if trying to sort out a software problem), move the log detail setting to debug.
Note that the logs are easily viewable by selecting Tools->Log Viewer in the main menu.
Number of log rotations
When the log reaches a maximum size (configurable below), it will be rotated. This means that if the log file in question is main.log, it will be renamed to main.log.1, and all of the other previously rotated log files will be renamed from main.log.1 to main.log.2, and so on. The number of log rotations determines how many of these files you would like to keep. A number of log rotations of three means that you plan to keep main.log, main.log.1, main.log.2, and main.log.3.
Maximum log file size
Choose the largest file size (in megabytes) that any log file will be allowed to reach before rotation. Note that the log files for multicore workers will be limited to one-fourth of this number. The maximum size on disk that can be taken by the collection log files is therefore

With the default settings of a 2MB log size and 3 rotations, the maximum amount of disk space consumed by the logs is then 16MB, assuming a quad core machine in which four worker processes are utilized.
Localization Preferences
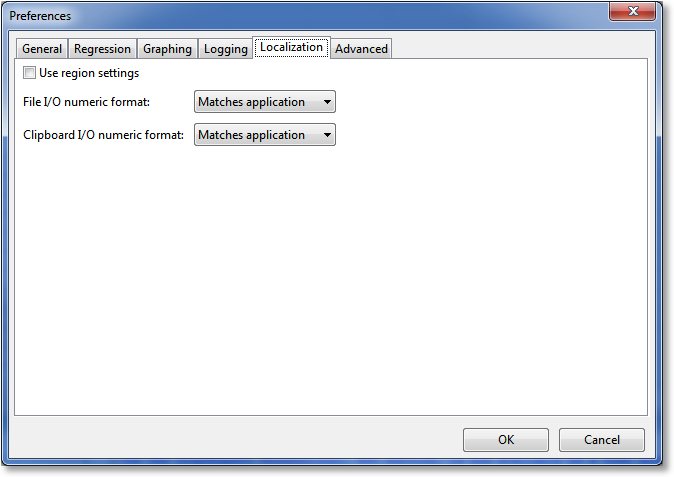
The localization preferences are documented in the Localization chapter, in the Configuring CurveExpert Professional to match your workflow section.
Advanced Preferences
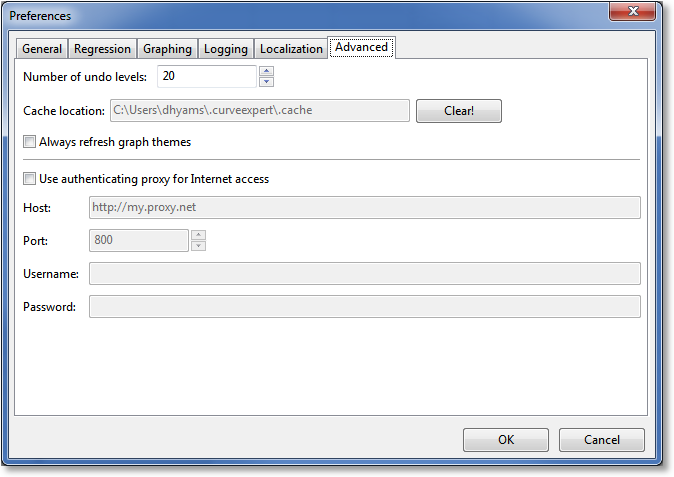
Number of undo levels
Any undo mechanism consumes some memory to save the previous state of the application; the number of undo levels setting allows you to customize how many previous states are saved that you can undo to. The parts of CurveExpert Professional that support Undo operations are the graphs, data spreadsheet, notes, and messages.
Cache location
The location of a cache that CurveExpert Professional uses. It is not changeable, but it can be cleared if need be. This cache operates very similarly to a web browser’s cache. Clearing it will not affect the correct operation of the program, but will force the regeneration of the information that was cached, slowing performance temporarily.
Always refresh graph themes
If set, this option will merge the graph themes from those available with the software (called the stock themes), to the user’s private theme directory ($HOME/.curveexpert/graph_themes). This happens whenever CurveExpert Professional starts. The purpose of keeping this option selected is that, when CurveExpert Professional is updated/reinstalled, the user will not get any new themes or updated themes that are shipped with the software. In most cases, merging the stock themes alongside your custom themes in $HOME/.curveexpert/graph_themes is the desired behavior.
It should be noted, however, that if you have deleted any of the stock themes, they will reappear. Also, if you have saved modified themes with the same name as the stock themes (which is not recommended), those themes will be overwritten.
If the behavior noted above is not desirable, uncheck this option. It should be remembered, though, that if left unset, the themes will not be updated when any new version of CurveExpert Professional is installed; the themes in the $HOME/.curveexpert/graph_themes folder will be left untouched.
Proxy settings
CurveExpert Professional uses Internet access to begin your trial period (see Installation and Activation), check for latest versions, upload issue reports (if enabled, see Automatically send issue reports), and upload logs (see Log Viewer). If you do not use a proxy, you can leave Use authenticating proxy for Internet access unchecked. However, if you are behind a proxy, please fill in the host, port and port for your proxy server (https:// or http:// in the server name is optional). If your proxy server requires authentication, also fill in the username and password fields with your username/password combination for the proxy server.