Getting started
This guide leads you through the bare minimum of information you need to know in order to run CurveExpert Professional successfully. See the User Interface chapter for a full explanation of the interface.
An introduction video is available; to watch it, click the blue video icon below (Internet connection required).

Load data into CurveExpert Professional
Read a sample file supplied with CurveExpert Professional. Choose File->Open, double click on “example_data”, set the file filter to *.dat, and double click the file “beanroot.dat”. When the File Import dialog appears, simply click OK. (see Reading Data)
Perform a Nonlinear Regression
Choose Calculate->Nonlinear Model Fit. Select the Sigmoidal Models, which automatically selects all of the members of that model family for computation. Click OK. (see Calculating Results)
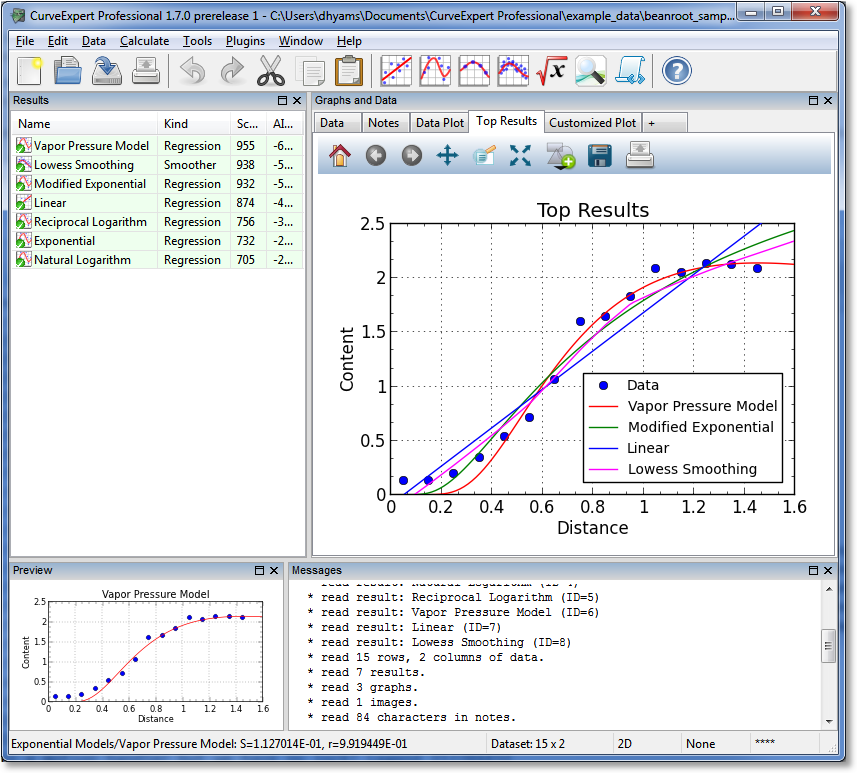
Examine the Results
As a result of the computation, the results will be shown in the left pane in CurveExpert Professional, ranked in order from the best fit to the worst fit (see Working with Results). Double click, or right-click and select Details…, on any of the results to see details (see Querying Result Details). Also, you can click the tabs in the graph stack (the right hand pane in the application window) to see visualizations of the results. Later, you can add graphs of your own.
Export a Table
Double click on a result in the Results pane to see its details, and click the Table tab in order to generate a table for that result (see Table).
Visualize your Results
In the “Graphs and Data” pane, two graphs have been automatically created for you; one that shows the data only, and one that shows the data plotted with the top few results that have been computed. To add a graph that you can manipulate freely, click the “+” tab in the “Graphs and Data” pane (see Graphing), and add results by simply dragging and dropping them from the “Results” pane.