Datasets
Introduction: Classifying dataset columns
Datasets in GraphExpert Professional are a two-dimensional table of numbers; a dataset is made up of a number of rows and a number of columns.
Datasets may have an arbitrary number of independent variables and an arbitrary number of dependent variables. Optionally, the dependent variable(s) may each have an associated standard deviation data column. If standard deviation columns are present, they follow each dependent variable column.
The layout of a dataset is:
{x1,x2,...,xj,y1,[std1],y2,[std2],...,yk,[stdk]}
where j is the number of independent variables, and k is the number of dependent variables. The brackets indicate optional columns.
Creating new datasets
New datasets in GraphExpert Professional can be created via several means, which are listed below.
From scratch
A new dataset can be created directly via the Create->Dataset menu choice (or the corresponding toolbar button). The following dialog will then appear:
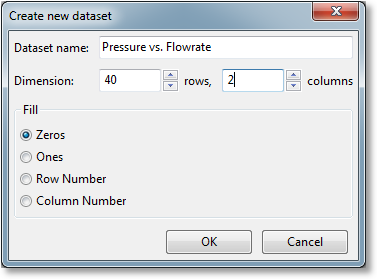
Here, you may set the dimension of the dataset (number of rows and number of columns), as well as the initial value of the values in the dataset. Choosing a Fill of Zeros or Ones will obviously fill the new dataset will all zeros or ones as appropriate. Choosing a Fill of Row Number or Column Number will fill your dataset with the one-based row or column number for each entry, respectively.
It is perfectly reasonable to create a new dataset with zero rows and zero columns; in this case, the usual workflow is to double-click the dataset in the “Components” panel in order to edit it and add values manually.
Importing from file
A new dataset can be created by reading a file with the raw values inside. To do this, choose File->Import Data; GraphExpert Professional provides a robust file import mechanism. The file to be read in may have any extension that you choose (.dat and .txt are common).
Most of the time, the data to be read in is contained within a text file of some sort, with headers and comments interspersed. GraphExpert Professional tries to make the job of importing this data as easy and painless as possible. The file import intelligently examines your raw file in order to find the data, as well as finding column headers for that data, if present.
After selecting the file to be read in, the file import dialog is displayed:
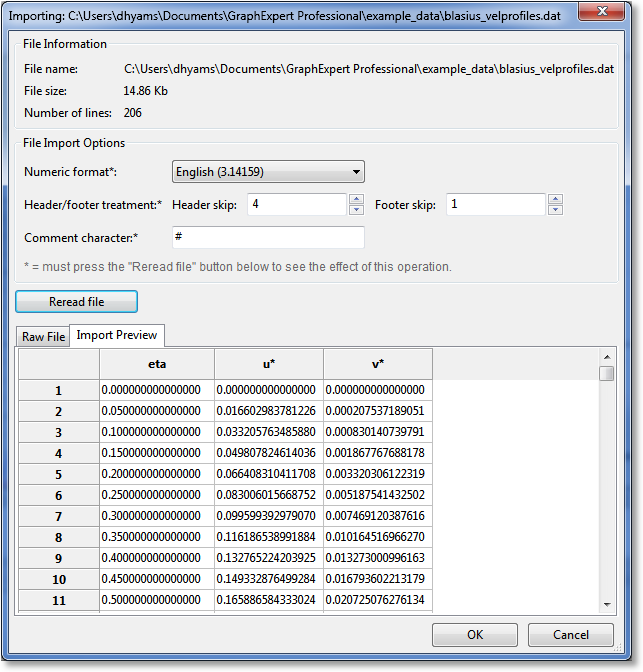
Basic information about the file is shown at the top of the window, where the complete path to the file, file size, and the number of lines detected in the file is displayed. The middle section of the window is where you set parameters necessary for reading in the file. Most of the time, default options are appropriate, and there is not much more to do except to glance at the spreadsheet preview in the bottom third of the window, and click the OK button. However, in cases where the defaults are not appropriate, there are a range of settings you can manipulate to read your file in successfully.
Numeric format
By default, the numeric format is set according to the settings in Edit->Preferences->Localization (see Localization). The two available settings are English (use dots for decimals) and European (use commas for decimals). Select the appropriate numeric format for your file.
Comment character
Most data files have comments interspersed throughout them, sometimes in the middle of the data. In order to skip these comments, the character that designates the comment must be specified. In the data file, then, anything that appears after a comment character is ignored. Common comment characters are ‘#’ and ‘%’.
Refreshing the preview
If changing the header/footer treatment, you must press the Reread file button to refresh the preview.
File import preview and raw file preview
The file import preview shows the result of the reading of the file, augmented by the current import settings discussed above. This preview shows you exactly what GraphExpert Professional will read as a dataset.
The raw file preview shows you a copy of the file, with no modification, so that you can see the contents. Line numbers are annotated on the left, the the header and footer skip settings are shown by dimming the areas of the file that are masked away by these settings.
Column Labels
GraphExpert Professional attempts to detect the labels of your columns, such that they are correctly read into the software. To detect the column labels, the file reader examines one line above the skipped header, if such a line exists. In other words, if the header skip is set to 10, line 10 is examined for the column labels. First, the line is trimmed of any white space and comment characters, and then broken into individual tokens. If the number of items on this line is the same as the detected number of columns, these tokens are treated as the column names, as long as they “look like” names. To look like a name, the labels must begin with an alphabetical character, and only contain legal punctutation “()+-*”. So, your data file can look something like this:
Comments at the top of the file are automatically
ignored by the file reader, because
it can tell
that there is no numeric data there.
# or you can comment with a designated comment character

time(s) voltage(volts)
1.0 4.5
2.0 4.23
3.2 4.1
In the example above, the column labels will be automatically detected as “time(s)” and “voltage(volts)”.
Other file metadata
To force the localization of a given text file, see File overrides for the required header information.
Finishing
When the file import preview looks like the desired dataset, hit OK; your data will be read and a new dataset created for it in the “Components” pane.
Importing from clipboard
A new dataset can be created from data stored on the clipboard. To do this, choose File->Import Data from Clipboard. If there is valid data present, it is immediately imported and made available in the “Components” pane. If valid data is not present, a message will appear in the “Messages” pane.
A typical use of this function is to import data from Excel or any other application that stores its data in a table-like format. Highlight the desired numerical data in the other application, copy it, and then switch to GraphExpert Professional and select File->Import Data from Clipboard. Alternatively, you may paste the data directly in the spreadsheet, if you have a dataset already created in GraphExpert Professional ready to receive the data. For this, see The spreadsheet.
Hot linking to a text or Excel file
In some cases, data is continually written to a file, or it is desired to automatically update a dataset within GraphExpert Professional when the data inside a particular file changes. Here, the hot linking support in GraphExpert Professional should be used. A hot link automatically updates the dataset whenever the underlying file (called the hot link) is changed. To be more specific, a file is “changed” whenever its modification time, as reported by the operating system, changes. A change in modification time is checked for periodically by GraphExpert Professional. A hot link can point to a regular text file, or to an Excel file (.xls or .xlsx).
To create a hotlink, select Create->Hot link from the menu, or click the corresponding toolbar button. The following dialog will appear:
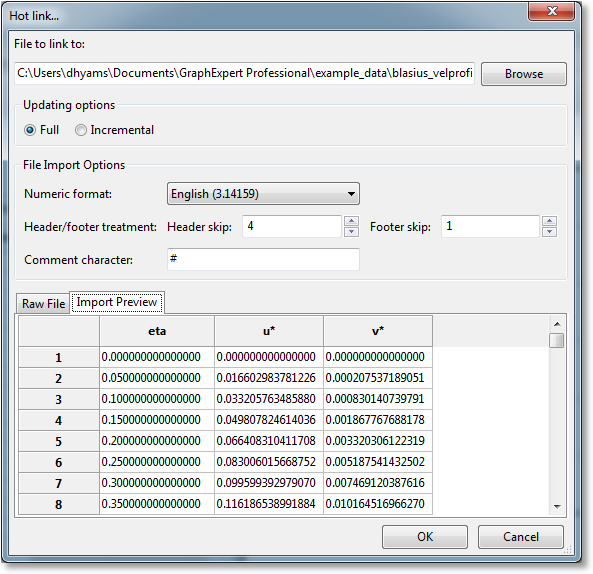
The first step to create a hot link is to set the name of the file to link to; the Browse button helps to locate the file if needed. Technically, however, the file does not need to exist at the time the hot link is created.
To a text file
The Updating options should then be set to Full or Incremental. A full hot link means that the entire file is reread each time the file changes. This type of updating is appropriate for files where the entire content might change. An incremental hot link is appropriate for files that have new values appended to them periodically (for example, a log file). Here, GraphExpert Professional only examines the bit of the file that has been added to the end of a file since the last update. The additional data is read and appended to the existing dataset.
Note
The data generated from an incremental hot link may become corrupt or incorrect if the update happens at exactly the same time that a third-party application is writing to the file. In this rare case, the data may be completely refreshed by right clicking the hot link in the “Components” pane, and selecting Force hot link refresh.
After the updating options, there are several File import options that will be used when reading the underlying file. These options are the same as that discussed above for the regular file importing procedure (see Importing from file). First, the Numeric Format can be set to English or European, in order to properly recognize the decimal points used within the file. Next, the Header skip and Footer skip can be set to skip over non-data items in your file. GraphExpert Professional looks at the file itself, and guesses at the appropriate header and footer skip, but obviously you are free to set these values as appropriate. Finally, the Comment character can be set, which tells the file importing mechanism within GraphExpert Professional which lines are non-data lines (i.e. comment lines). All comment lines will be skipped automatically as the file is read.
The previewing pages at the bottom of the dialog show the contents of the file itself, as well as what the data in the file looks like after reading, using the current import settings.
Once the OK button in this dialog is pressed, the hot link will appear in the “Components” pane, and will automatically update when the underlying file changes.
To an Excel file
GraphExpert Professional supports hot linking directly to data inside of an Excel(TM) file, in either .xls or .xlsx formats. This is often of great convenience to the practitioner, since often the raw data is contained in a spreadsheet; this Excel connector allows GraphExpert Professional to connect directly to that data source rather than requiring a second copy of the data.
To create this hot link, just point the “File to link to:” entry to an Excel file. As soon as a .xls or .xlsx file extension is detected, the dialog will change its controls such that the location of the data within the spreadsheet may be set as follows:
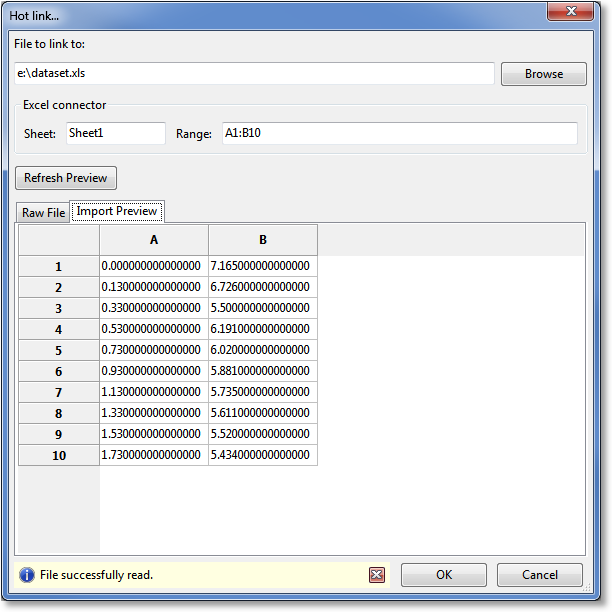
In the Excel Connector section, enter the sheet name where the data resides, as well as the range where the data resides. The range is specified exactly as you see the data within the Excel spreadsheet. A simple example of a range, which extracts two columns and ten rows from the top left corner of a particular sheet, is:
A1:B10
Also, noncontiguous ranges are supported through the use of the comma notation:
A1:B10,D2:D11
would result in a 10x3 dataset. If the number of rows between noncontiguous selections does not match, GraphExpert Professional automatically pads each column with zeros such that each column of the dataset has a consistent number of rows. Press the Refresh Preview button to see the results of your extraction settings.
The previewing pages at the bottom of the dialog show the results of the Excel(TM) data extraction, using the current File, Sheet, and Range settings. Once the OK button in this dialog is pressed, the hot link will appear in the “Components” pane, and will automatically update when the underlying Excel(TM) file changes. Note that live changes in the Excel(TM) file cannot be tracked; the Excel(TM) must be saved for GraphExpert Professional to “notice” that something has changed.
A hot link to an Excel file behaves just as another other hot link does. The modification time of the Excel file is monitored, and if the file is updated, your data in GraphExpert Professional is automatically updated.
Reclassifying columns
A dataset, since it is just a collection of columns, needs some additional information as to how to interpret the meaning of those columns (i.e. which columns are independent variables, dependent variables, or standard deviation). This “metadata” in GraphExpert Professional is accomplished by explicitly storing the list of columns that make up the independent variables, dependent variables, and standard deviation columns. GraphExpert Professional, by default, guesses that the first column of a dataset is the independent variable and the rest are dependent variables (except in the case of a one-column dataset, in which case it guesses that the column is a dependent variable). If this guess is not correct for your data, you will need to reclassify the columns in order to describe what each column contains.
Note
Even child datasets can have their columns reclassified. Reclassification affects the metadata of the dataset, not the data itself (which updates automatically), and therefore is a legal and logical operation to perform on a child dataset.
To reclassify the columns of a dataset, right click a dataset in the “Components” pane and select Reclassify. Doing so will display a dialog similar to the following:
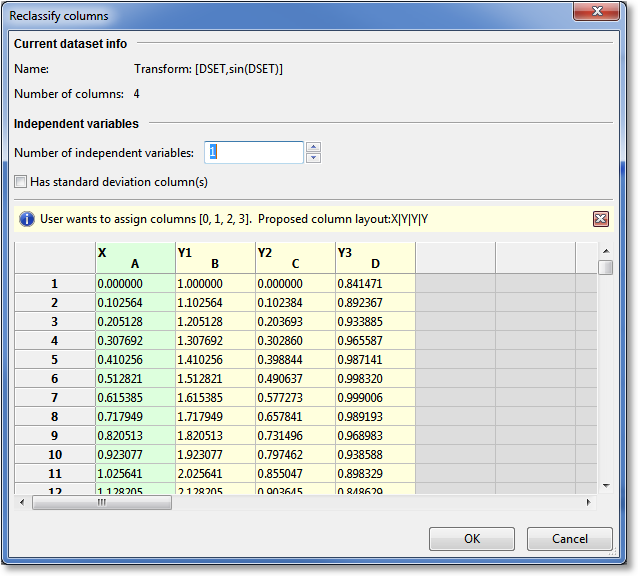
The top section of the dialog gives some information about the dataset being reclassified, such as the name and number of columns in the dataset.
The next section of the dialog, Independent variables, allows you to set the number of independent variables in the dataset, and also whether or not standard deviation columns are present. If standard deviation columns are present, there shold be one stddev column following each dependent variable column.
As selections are made in the upper part of the dialog, the lower part shows a preview of the dataset, simultaneously informing the user the effects of the independent variable settings and standard deviation column settings. Independent variable columns are colored green, and dependent variable columns are colored yellow. Standard deviation columns are colored orange. Finally, unused columns are colored red.
It is not erroneous to leave certain columns unused in a dataset. GraphExpert Professional will behave appropriately should you graph the dataset; any unused columns are ignored. The red highlighting and warning message in this dialog is there to inform the user of that fact, however.
Also for identification, each column header is labeled with “X”,”Y”, or “STD” in the upper left area of the header; this means that the column is currently tagged as an independent variable, dependent variable, or standard deviation column, respectively. The same information is shown in the middle information bar as in the following example:
User wants to assign columns [0,1]. Proposed column layout: X|Y|S|_
Again, “X” means independent variable, “Y” means dependent variable, “S” means a standard deviation column, and “_” means that the column is currently unassigned to any role.
If the reclassification settings are invalid, this fact will be shown also in the information bar area above the dataset preview.
It is perfectly reasonable to set the number of independent variables to zero. In this case, GraphExpert Professional, uses the one-based row index of each data value as the independent variable when needed (i.e. for graphing).
Data statistics
Simple statistics for the current dataset can be obtained by selecting Data->Statistics. The resulting window will display the number of points and columns, and the following stats for each column of your dataset:
minimum
maximum
range
average (mean)
standard deviation
The average is computed with the standard formula:

Standard deviation is computed with the following formula, which is called the standard deviation of the sample:

To copy the statistics information to the clipboard, press the Copy button at the bottom of the dialog.
The spreadsheet
The spreadsheet resides in the “Dataset Editor” pane in GraphExpert Professional.
The spreadsheet allows manual entry or modification of a dataset either entry-by-entry, or by cutting and pasting from within GraphExpert Professional, or from other sources. An example of the spreadsheet is shown below;
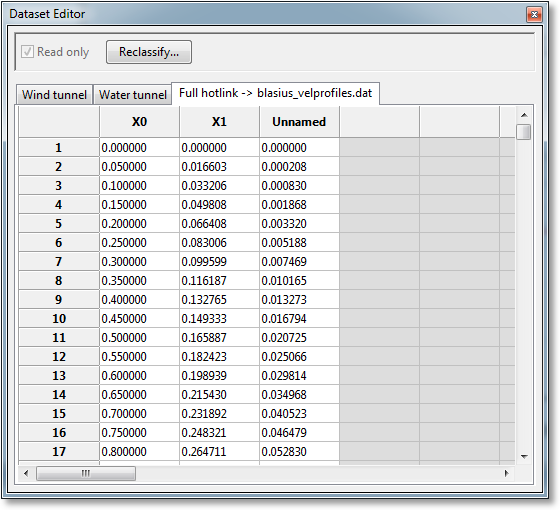
All cells that hold data are white, and cells that are not part of the dataset are colored in gray. At the end of the dataset is one light-gray row, which signifies that the cells may be typed into (in order to add data points), but are not yet part of the dataset.
Right-click the spreadsheet in order to access operations that you can perform on the data itself, in-place.
The name of a column of data can be changed by right-clicking the appropriate column header and selecting Rename Column (alternatively, double click the column header). These names are for user information only, but are used if an entire dataset with multiple dependent variables is sent to a graph; the column names are used to differentiate the various curves in the legend.
The name of a row of data can be changed by right-clicking the appropriate row header and selecting Rename Row (alternatively, double click the row header). These names are currently for user information only.
Cursor Movement
Cursor movement in the spreadsheet is normally accomplished with the TAB and RETURN keys; TAB moves the cursor to the right, and RETURN moves the cursor downward. Of course, the arrow keys and PAGEUP/PAGEDOWN may also be used to move the cursor. If it is desired to move the cursor with a carriage-return like approach (in which the RETURN key moves the cursor to the next line if at the end of a row), this can be selected in Edit->Preferences->General->Excel style cursor movement.
To reverse the direction of cursor navigation, hold the SHIFT key.
Cutting, Copying, and Pasting
When copying data, the current selection in the spreadsheet is placed on the clipboard (and obeys your regional settings while doing so). If no data is selected, all data is copied. The delimiter used between columns, if applicable, is the delimiter chosen in Edit->Preferences->General->Default Delimiter.
A “cut” must either be a complete set of rows, or a complete set of columns in the dataset. Therefore, the “Cut” item in the data menu is dimmed if your selection does not fit the above criteria. This behavior is due to the fact that a cut can remove complete rows or complete columns from your dataset, but cannot create a “hole” in the dataset.
A paste from the clipboard informs GraphExpert Professional to attempt to intelligently read what is on the clipboard and turn that into an intermediate dataset for subsequent pasting. Different rows in this intermediate dataset are delimited by newlines (or carriage returns), and columns are delimited by whitespace or commas (unless using European format for incoming numbers, in which case commas are not valid as a delimiter). This intermediate dataset will then be inserted at the current cursor location in the spreadsheet, overwriting parts of your existing dataset and extending your existing dataset as necessary. A paste operation can be viewed as an insertion of a block of data at the current cursor location, following by a subsequent discarding of any data that happens to fall outside the current number of columns of your dataset.
Inserting Rows
To insert a row into your dataset, right click on the spreadsheet and select “Insert Row”. This will cause all rows at or below the current cursor location (indicated by the black outline) to be shifted downwards, and a new row will be inserted at the current location.
To insert multiple rows at once, select a range in the spreadsheet, right click, and select “Insert Row” as before. In this case, all rows touched by the selection will be shifted downwards, and new rows are inserted at the current cursor location. The number of inserted rows will equal the number of rows in the original selection. For example, to insert three rows at row 2, select rows 2-4 (inclusive) and select “Insert Row”.
Inserting a Column
To insert a column into your dataset, right click on the the spreadsheet and select “Insert Column”. For this option to appear, you must either be right clicking on a column header, or have a complete set of columns selected in the spreadsheet. A column will be inserted at the leftmost selection point, with following columns pushed rightward in order to make room. Note if the dataset is a member of any plot, it will be removed; insertion of a column means that the dataset is implicitly reclassified, which forces its removal from graphs that it appears in.
Removing Rows
To remove rows from the dataset, select a set of rows to be removed, right click, and select “Remove Rows”. This is functionally similar to cutting the rows (see above), except that the data is not copied to the clipboard.
Removing Columns
To remove columns from a dataset, right click on the spreadsheet and select “Remove Column”. For this option to appear, you must either be right clicking on a column header, or have a complete set of columns selected in the spreadsheet. All selected columns will be removed, with the unremoved columns to the right of the selection sliding left to fill the vacated space. Note if the dataset is a member of any plot, it will be removed; insertion of a column means that the dataset is implicitly reclassified, which forces the removal from graphs that it appears in.
Undo and Redo
So, you can feel comfortable manipulating data knowing that any transformation, clear, or cut/paste operation can be undone.
Number Formatting
The values shown in a spreadsheet may be formatted by selecting a block via the mouse, right clicking, and selecting Format Numbers from the resulting menu. A dialog will appear as follows:
A General formatting prints a number naturally as most practitioners would write the number. Scientific formatting prints the number always with a mantissa and exponent part, as in “1.532e+04”. Engineering formatting is almost the same as scientific, but the exponent is always guaranteed to be a multiple of three. Percentage formatting shows a decimal as a percentage, with a following percentage sign. For example, the number 0.05 would be shown as 5.0%.
The Decimal places field allows the user to specify the number of decimal places shown; this setting is relevant for all formatting settings listed above except for General.
The Leader and Trailer fields allow the user to place customized text before and/or after the number. These fields are very useful for adding units to numbers (use the trailer) or prepending a dollar sign for currencies (place $ in the Leader field).
Operating on Data
GraphExpert Professional provides several ways that you can operate on raw data in the spreadsheet. To perform these operations, simply highlight the data that you want to work on, right click the spreadsheet, and then select one of the data operations from the resulting context menu. If no selection is made, the operation is assumed to apply to the entire dataset (all rows and all columns). Note that any operation performed in this manner is done in-place; i.e., the dataset is being directly modified and no children are created.
Sort
To sort your data against the first column of the dataset, select Sort from the Data menu (the entire dataset must be selected in the spreadsheet). If GraphExpert Professional has detected that the data is already sorted, this menu item will be dimmed. If the choice is nondimmed, however, it does not necessarily mean that the dataset is already sorted.
Sorting your dataset is crucial for splining of your data, integrating your data, differencing your data, or other operations that depend on the data being sorted. Remember that the sorting, if performed directly on the data using the spreadsheet, performs the sorting in-place and no child will be created.
Scale
To multiply by or divide the selected data by a factor, right click on the spreadsheeet and pick Scale. The scaling is performed in-place on the dataset (i.e. no child is created).
Translate
To add a constant value to the selected data, right click on the spreadsheet and pick Translate. The translation is performed in-place on the dataset (i.e. no child is created).
Crop
To drop points from the selected part of your dataset that are above or below a certain threshhold, right click on the spreadsheet and pick Crop. After a cropping operation, there is likely to be fewer data points in your data set than before the crop. Usually, cropping is used to eliminate outliers from a dataset.
Clamp
To clamp points in the selected part of your dataset to a certain threshhold value, right click on the spreadsheet and select Clamp. Clamping is usually used to correct values that are slightly over or under a valid domain for that value.
Rotate
To rotate columns in a dataset, right click on the spreadsheet and select Rotate. For a dataset with two columns, this is exactly the same as a column swap. Note that the rotation always proceeds to the left in a circular fashion; the leftmost column becomes the rightmost one after the rotation, and all other columns are displaced by one to the left.
Transforming Data
Right clicking on the spreadsheet and picking Transform allows you to map the selected part of your dataset through a general function. If this menu item is selected, you can enter an expression, as a function of x, and all selected data will be evaluated via this function. Note that “x”, in this context, just refers to the selected data.
For example:
x + 5
pow(x*100,0.75)
degrees(x)
In the transformation, you may use any functions listed in Appendix A: Math Functions. Note that both the Scale and Translate operations above can just as easily be done via a transformation here.
Transforming data directly in the spreadsheet does the operation in-place, and does not create a child dataset. To create a dataset transformation that does create a child dataset, see Transform.
Extracting Data
A subset of the dataset in the spreadsheet can be extracted as a child of the dataset. To do this, simply highlight the desired section of your dataset that you would like to extract, right click the spreadsheet, and select Extract Selection. This will create a child of that dataset, which will automatically update its data as the parent is modified.
The selection must be a contiguous section of the dataset.