Working with Data
Introduction
The raw data in CurveExpert Basic is handled as a simple matrix of numbers; the dataset is made up of a number of rows and a number of columns. The first column is interpreted as the independent variable, and the second column is interpreted as the dependent variable.
Data statistics
Simple statistics for the current dataset can be obtained by selecting Data->Statistics. The resulting window will display the number of points and columns, and the following stats for each column of your dataset:
minimum
maximum
range
average (mean)
standard deviation
The average is computed with the standard formula:

Standard deviation is computed with the following formula, which is called the standard deviation of the sample:

To copy the statistics information to the clipboard, press the Copy button at the bottom of the dialog.
The spreadsheet
The spreadsheet resides in the “Graphs and Data” pane in CurveExpert Basic.
The spreadsheet allows manual entry or modification of a dataset either entry-by-entry, or by cutting and pasting from within CurveExpert Basic, or from other sources. An example of the spreadsheet is shown below;
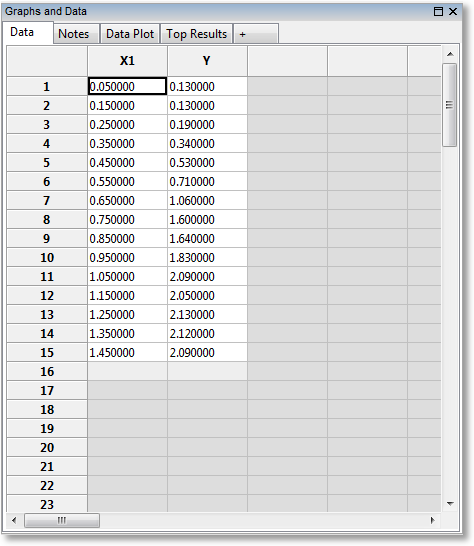
All cells that hold data are white, and cells that are not part of the dataset are colored in gray. At the end of the dataset is one light-gray row, which signifies that the cells may be typed into (in order to add data points), but are not yet part of the dataset.
Right-click the spreadsheet in order to access operations that you can perform on the data itself, in-place.
The name of a column of data can be changed by right-clicking the appropriate column header and selecting Rename Column (alternatively, double click the column header). These names are for user information/convenience only.
The name of a row of data can be changed by right-clicking the appropriate row header and selecting Rename Row (alternatively, double click the row header). These names are currently for user information only.
Cursor Movement
Cursor movement in the spreadsheet is normally accomplished with the TAB and RETURN keys; TAB moves the cursor to the right, and RETURN moves the cursor downward. Of course, the arrow keys and PAGEUP/PAGEDOWN may also be used to move the cursor. If it is desired to move the cursor with a carriage-return like approach (in which the RETURN key moves the cursor to the next line if at the end of a row), this can be selected in Edit->Preferences->General->Excel style cursor movement.
To reverse the direction of cursor navigation, hold the SHIFT key.
Cutting, Copying, and Pasting
When copying data, the current selection in the spreadsheet is placed on the clipboard (and obeys your regional settings while doing so). If no data is selected, all data is copied. The delimiter used between columns, if applicable, is the delimiter chosen in Edit->Preferences->General->Default Delimiter.
A “cut” must involve all columns of the dataset. Therefore, the “Cut” item in the data menu is dimmed if your selection only involves some of the columns. This behavior is due to the fact that a cut will remove points from the dataset, and your selection should reflect that reality.
A paste from the clipboard informs CurveExpert Basic to attempt to intelligently read what is on the clipboard and turn that into an intermediate dataset for subsequent pasting. Different rows in this intermediate dataset are delimited by newlines (or carriage returns), and columns are delimited by whitespace or commas (unless using European format for incoming numbers, in which case commas are not valid as a delimiter). This intermediate dataset will then be inserted at the current cursor location in the spreadsheet, overwriting parts of your existing dataset and extending your existing dataset as necessary. A paste operation can be viewed as an insertion of a block of data at the current cursor location, following by a subsequent discarding of any data that happens to fall outside the current number of columns of your dataset.
Inserting Rows
To insert a row into your dataset, right click on the spreadsheet and select “Insert Row”. This will cause all rows at or below the current cursor location (indicated by the black outline) to be shifted downwards, and a new row will be inserted at the current location.
To insert multiple rows at once, select a range in the spreadsheet, right click, and select “Insert Row” as before. In this case, all rows touched by the selection will be shifted downwards, and new rows are inserted at the current cursor location. The number of inserted rows will equal the number of rows in the original selection. For example, to insert three rows at row 2, select rows 2-4 (inclusive) and select “Insert Row”.
Removing Rows
To remove rows from the dataset, select a set of rows to be removed, right click, and select “Remove Rows”. This is functionally similar to cutting the rows (see above), except that the data is not copied to the clipboard.
Undo and Redo
All data operations are undoable and redoable to a number of levels possible by the Edit->Preferences->Advanced->Peak Undo Memory Usage setting. All data operations are undoable and redoable to a number of levels possible by the Edit->Preferences->Advanced->Number of undo levels setting. So, you can feel comfortable manipulating data knowing that any transformation, clear, or cut/paste operation can be undone.
Number Formatting
The values shown in a spreadsheet may be formatted by selecting a block via the mouse, right clicking, and selecting Format Numbers from the resulting menu. A dialog will appear as follows:
A General formatting prints a number naturally as most practitioners would write the number. Scientific formatting prints the number always with a mantissa and exponent part, as in “1.532e+04”. Engineering formatting is almost the same as scientific, but the exponent is always guaranteed to be a multiple of three. Percentage formatting shows a decimal as a percentage, with a following percentage sign. For example, the number 0.05 would be shown as 5.0%.
The Decimal places field allows the user to specify the number of decimal places shown; this setting is relevant for all formatting settings listed above except for General.
The Leader and Trailer fields allow the user to place customized text before and/or after the number. These fields are very useful for adding units to numbers (use the trailer) or prepending a dollar sign for currencies (place $ in the Leader field).
Operating on Data
CurveExpert Basic provides several ways that you can operate on raw data in the spreadsheet. To perform these operations, simply highlight the data that you want to work on, and select one of Sort, Scale, Translate, Transform, Crop, or Clamp from the Data menu. Alternatively, you can right click on the spreadsheet after making a selection. If no selection is made, the operation is assumed to apply to the entire dataset (all rows and all columns).
Sort
To sort your data against the first column of the dataset, select Sort from the Data menu (the entire dataset must be selected in the spreadsheet). If CurveExpert Basic has detected that the data is already sorted, this menu item will be dimmed. If the choice is nondimmed, however, it does not necessarily mean that the dataset is already sorted.
Scale
To multiply by or divide the selected data by a factor, select Data->Scale.
Translate
To add a constant value to the selected data, select Data->Translate.
Crop
To drop points from the selected part of your dataset that are above or below a certain threshhold, select Data->Crop. After a cropping operation, there is likely to be fewer data points in your data set than before the crop. Usually, cropping is used to eliminate outliers from a dataset.
Clamp
To clamp points in the selected part of your dataset to a certain threshhold value, select Data->Clamp. Clamping is usually used to correct values that are slightly over or under a valid domain for that value.
Rotate
To rotate columns in a dataset, select Data->Rotate. For a dataset with two columns, this is exactly the same as a column swap. Note that the rotation always proceeds to the left in a circular fashion; the leftmost column becomes the rightmost one after the rotation, and all other columns are displaced by one to the left.
Transforming Data
Data->Transform allows you to map the selected part of your dataset through a general function. If this menu item is selected, you can enter an expression, as a function of x, and all selected data will be evaluated via this function. Note that “x”, in this context, just refers to the selected data.
For example:
x + 5
pow(x*100,0.75)
degrees(x)
In the transformation, you may use any functions listed in Appendix A: Math Functions. Note that both the Scale and Translate operations above can just as easily be done via a transformation here.