The CurveExpert main window is divided into five main parts: the data window, ranking chart, the toolbar, menu bar, and the status bar. A sample CurveExpert window is shown below:
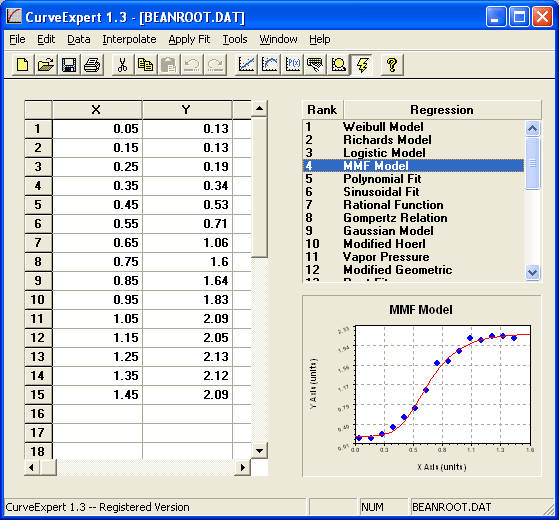
The toolbar gives access to frequently used commands. Watch the status bar (at the bottom of the main window) as you move the mouse across each button to find the function of each one of these buttons.
The status bar shows you the current status of CurveExpert and gives you help on the function of the toolbar buttons.
This window is the spreadsheet-like interface that occupies the left side of the CurveExpert main window. The data window holds all of the data that is to be modeled. The first column of data is the x data, while the second column holds the y data. As of this version of CurveExpert, the third column is not used. To edit a data point, simply click the cell that it is in and type in the new value.
The ranking chart ranks all of the valid regression models from best to worst. The standard error and correlation coefficient (described in detail in the Data Modeling section) are used to determine these rankings. Selecting an entry in this chart causes it to be previewed in the Graph Preview Area, and double-clicking an entry opens a graphing window for that particular fit. Note that interpolations are not included on this list.
The graph preview area shows the currently selected plot in the ranking chart (above), as a small thumbnail, so that you can quickly visualize different curve fits without opening a large number of graphing windows. This preview window also gives the capability of watching a regression as it progresses to convergence.
The graph preview area on the CurveExpert main window gives you an easy way to quickly visualize various curve fits that have been performed. As a regression is completed, an entry appears for it in the ranking chart (also on the CurveExpert main window). Clicking an entry in the ranking chart causes the plot preview area to generate a graph of that particular regression. If no regression is selected, the preview area simply shows the data present in the built-in spreadsheet. Note that the preview area will update every time the data set is changed, so it always reflects the latest changes to the data set.
The preview area also gives the capability to visualize regressions as they progress to convergence. At the end of each iteration, the preview is redrawn with the latest estimates of the parameters. The result is an animation of the curve fit as it attempts to achieve the best estimate of your data. For animations to occur, the Enable Animations menu item must be checked (see below). Note that the colors, axes, etc. of the plot preview area are determined by the default plot setup, and cannot be customized directly. To open a plot that is customizable, double-click the plot preview, and a full graphing window will appear which can be manipulated as desired.
Right-clicking on the preview area shows a menu that allows you to customize the behavior of the preview. The items are listed below:
Turn the preview area on or off. When on, the preview area has the behavior described in the documentation above. When off, the preview does not draw any graphs. If the data and/or curve fit takes a significant amount of time to regenerate, you might want to turn previews off. Default: On
Turn preview animations on or off. When on, the preview area graphically shows the progression of a regression to convergence during a calculation. When off, no updates occur during a calculation. If fast performance is a key issue, then you might want to disable animations obviously, time is added to each iteration to redraw the preview area. Default: On
Open a graphing window for the plot shown in the preview area. This can also be accomplished by double-clicking the preview area.
Get help on how to use the graph preview area.
While the calculation proceeds, you can watch the status bar to see what regression is being calculated, the iteration number, and (most importantly) the current chi-square value of the model as the nonlinear regression algorithm progresses. The chi square lets you know how well the model is currently fitting the data, and it should be steadily decreasing, in an optimum situation. When CurveExpert is working, the toolbar andmenus are disabled except for two new buttons on the far right hand side of the toolbar. Note that for interpolations and linear regressions, each button has the same meaning. They will both terminate the calculation immediately and no results will be shown. Also note that if background processing is disabled, these buttons will also be disabled; in effect, the ability to stop the calculation (in a graceful manner) is lost if background processing is disabled.
Press this button to stop the computation for a particular curve fit. The parameters are accepted as they are; this button is handy when the standard error has dropped to a stable value, but CurveExpert is continually “tweaking” the values of the parameters to arrive within the tolerance bounds set in the File|Preferences dialog. Selecting this button will accept the current parameters as they are. The same operation can be accomplished by pressing Esc on the keyboard.
Press this button to abort all calculations immediately. The same operation can be accomplished by pressing Shift+Esc on the keyboard.
Choose “Print” from the main menu to generate a hardcopy of the data set. The data set will be printed in two columns of x and y data, and each point is labeled sequentially. If the printer is not set as desired, press the Setup button and configure the printer. Pressing OK will commence printing, and pressing the Cancel button will return you to the CurveExpert main window.
To print a graph, right click on a graph, and select Print. Selecting this menu item prints a hardcopy of the current plot. A print dialog will be shown that will allow you to select printers and change the print setup. If the printer is not set as desired, press the Setup button and configure the printer. Pressing OK will commence printing, and pressing the Cancel button will return you to the CurveExpert graph window.
Note that you may select whether the printout will be in color or black and white by selecting the Black and White and Color radio buttons at the bottom of the dialog. If you have a black and white printer and select a color plot, then the plot will be grayscaled before it is sent to the printer.