CurveExpert supports a flexible text file format for easy data import and supports four types of data manipulation after the file has been read.
Data files in CurveExpert are simply two-column text files with the first column for the x data, and the second column for the y data. See Data Requirements for more information on the permissible format of a CurveExpert data file.
Simply choose the file that you want to use, and CurveExpert will read that file, examine it, and display the data in the main window for manipulation. If necessary, you may manually edit the data or use the data manipulation features included in the Data menu. You are now ready to perform some curve fits on the data using the Apply Fit or Interpolate menu.
Note that you may select the Read Only checkbox to prevent the file that you have opened from being written to at any time during a CurveExpert session. This keeps accidental saves from overwriting possibly valuable comments and data in the file that was initially opened. A protected/read-only file’s name will appear in the status bar in red.
While CurveExpert reads a file, the status bar shows the state of the file being read. The first section of the status bar shows the file name, the second section shows the number of lines parsed, and the third section shows the number of data points read. Finally, the last section shows the action being taken (SCANNING or READING). On each file read, CurveExpert scans the file on the first pass, and reads the file on the second pass.
Data files will be written in two column form with no headers or footers. A tab separates the first and second columns. Note that if a data file that contains comments is read into CurveExpert and subsequently saved over the same file, the original comments are lost.
While CurveExpert saves a file, the status bar shows the state of the file being written to. The first section of the status bar shows the file name, the second section shows the number of lines written, and the third section shows the number of data points written. Since CurveExpert writes one data point per line, these numbers will be identical. Finally, the last section shows the action being taken (WRITING).
CurveExpert reads a plain ASCII text file, which consists of columns. You can produce these text files by hand, by spreadsheet, or any other method that can produce two columns of data. Note that the type of delimiter in the data file is irrelevant – the columns need only be separated by a nonnumeric character. Therefore, the data file may have tab, space, or comma delimited data.
Comments may be interspersed freely within the data files, with the only restriction being that comments must either be placed on a line by themselves or after any data on that line. Note again that there must be two numbers on a line for the data to be read correctly, and that if a line starts with a number, it is assumed to be a data line. If it starts with a nonnumeric character, the line is assumed to be a comment. Here are two examples, where the user wants all of the numeric data in the file to be read into CurveExpert:
Incorrect:
1.0
2.5
2.0
2.7
2.5
2.9
this is text 2.9
3.1
3.1
3.2
Correct:
1.0
2.5
2.0
2.7
2.5
2.9
2.9
3.1 this is text
3.1
3.2
When CurveExpert reads the first example, it assumes that the line with ‘this is text’ is a comment, and that line is discarded. In the second example, the line with the comment starts with a number and is read correctly.
CurveExpert allows a large amount of flexibility when reading data files. A column can be added to the data set, columns can be skipped. As soon as a file is selected to be read [note that for this to be true, the “Always Show Import Dialog” setting in Tools|Options must be checked] , the file import dialog is displayed, allowing the user to select the manner in which the file should be read. If the file is a simple two column data file, then the default settings in each field are adequate. The File Import dialog is shown below, and explanations of each item contained within it follow.
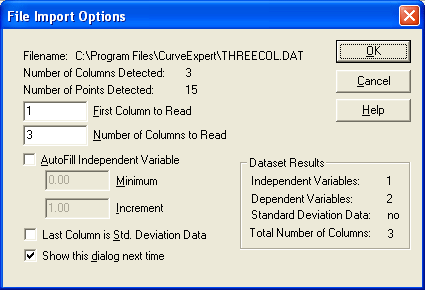
The full path to the file selected is stated first in the “Filename” field. Then, the number of data points and columns that CurveExpert has detected in the data file is specified. This information should be checked whenever a file is read to ensure that the file contains the expected data in a valid format. See Data File Requirements for more information on this topic.
Along the left side of the dialog, the user-selectable options are listed. Place the first column that should be read from the data file in theFirst Column to Read field. Specify the number of columns to read in theNumber of Columns to Read field. The default values for these fields are to start on the first column and read all columns in the data file. If theAutofill Independent Variable option is selected, then CurveExpert will automatically fill the independent variable (x) data column with a linear sequence. The first number in this sequence is specified in theMinimum field, and the increment is specified in theIncrement field. Autofilling adds one column to the data set. The provided column will be the length specified in the “Number of Points Detected” information field. If the data set contains a column that should be interpreted as standard deviation data (uncertainty data) for the dependent variable (y), then select theLast Column is Standard Deviation Data checkbox. CurveExpert will use the last column read as the standard deviation data.
The region labeled “Dataset Results” gives the result of the combination of the read data file and the user-selectable options. The number of independent variables, dependent variables, and columns is specified here. Also, whether the data set contains standard deviation data is also given. If the file is not yet valid to be read, asterisks appear in these fields. Adjust the user-selectable items until the desired values appear in the dataset results. Note that CurveExpert can only accept one independent variable and one independent variable at this time.
If you are always reading simple two-column text files, then this dialog can be suppressed. Deselect theShow This Dialog Next Time checkbox before exiting this dialog to accomplish this. To regain access to this dialog at a later time, select “Tools|Options” and re-check “Always show file import dialog”.
Manipulating your data using the built-in features of CurveExpert can be very beneficial to curve fit performance. Please review Avoiding Floating Point Exceptions.
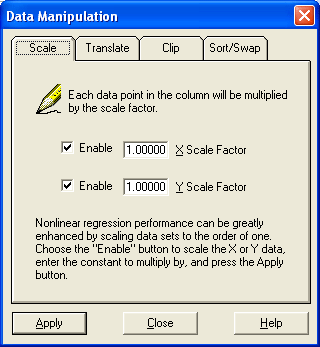
All data manipulation options are organized into a dialog that is obtained via the Data|Manipulate menu.
At any time, you can always click on the numbers in the built-in spreadsheet and modify the numbers. Also, if you click on the row one past the end of the dataset (or press return while modifying the last row of a dataset), CurveExpert will allow you to add a new data point by typing directly into the spreadsheet.
To obtain the best curve fitting performance, you should scale your data to order one if the data is extremely large or small. Review Avoiding Floating Point Exceptions and Computational Performance for reasons why you might want to scale your data.
The Data Manipulation dialog box is the control that you use to multiply your data set by a scaling factor. After opening this box via the Data|Manipulate menu choice, press the “Scale” tab. To scale your data set, type in the desired scale factor into the scaling fields, and select the “Enable” buttons if you want a scale factor to be applied to the indicated column of data. Leaving the “Enable” checkboxes unselected means that CurveExpert will ignore the factor in the corresponding field. Finally, click the “Apply” button; the results of the scaling will immediately be apparent in the main window’s spreadsheet.
Note that after scaling the data, CurveExpert does not automatically get rid of the current curve fits (to prevent work that you have done from being lost). If you wish to clear the curve fit cache, then select Tools|Clear Curvefits.
Translating your data by a fixed additive factor can remove a known bias from the data set, as well as allow a better choice of a function to model the data. The Data Manipulation dialog box is the control that you use to add a factor to your data set. After opening this box via the Data|Manipulate menu choice, press the “Translate” tab.
To translate your data set, type in the desired translation factor into the scaling fields, and select the “Enable” buttons if you want translation to be applied to the indicated column of data. Leaving the “Enable” checkboxes unselected means that CurveExpert will ignore the factor in the corresponding field. Finally, click the “Apply” button; the results of the translation will immediately be apparent in the main window’s spreadsheet.
Note that after translating the data, CurveExpert does not automatically get rid of the current curve fits (to prevent work that you have done from being lost). If you wish to clear the curvefit cache, then select Tools|Clear Curvefits.
Clipping (or pruning) your data means to remove any outliers that might contaminate a curve fit which is applied to your data set. This operation clips the data at a given x/y maximum and minimum. The Data Manipulation dialog box is the control that you use to clip outliers from the data set. After opening this box via the Data|Manipulate menu choice, press the “Clip” tab. Fill in the desired maximum and minimum for the x/y data, and press the Apply button. The results of the data clipping operation will be immediately apparent in the main window’s spreadsheet.
Note that after clipping the data, CurveExpert does not automatically get rid of the current curve fits (to prevent work that you have done from being lost). If you wish to clear the curve fit cache, then select Tools|Clear Curvefits.
CurveExpert can sort the entire data set, using the either the independent variable (x) or the dependent variable (y) as the key. When this operation finishes, all of your data will be in order of the key that was chosen. This operation is crucial for interpolation-type data fits. The Data Manipulation dialog box is the control that you use to sort the data set. After opening this box via the Data|Manipulate menu choice, press the “Sort” tab. To sort the data set, choose the appropriate sort key (x or y) and press the Apply button. The results of the sorting operation will be immediately apparent in the main window’s spreadsheet. If the independent variable (x) is used as the key, the result of the sorting will be a data set that is in order with increasing x. Conversely, if the dependent variable (y) is used, the data set will be in order with increasing y.
Note again that sorting the data set on x is crucial for interpolation type curve fits.
The data information dialog gives you statistical information about the current data set in CurveExpert; select Data|Information from the main menu. First, the number of data points in set is given, along with the memory requirement of storing that data. Note that the “memory allocated” statistic shows the total amount of memory allocated for data, curve fits, and open graphing windows.
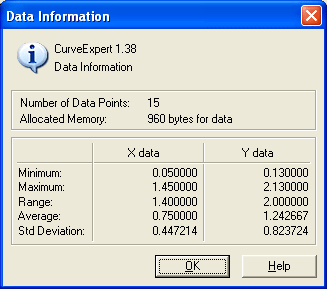
Other statistics given by this dialog are the average, minimum, maximum, and standard deviation from the mean of both the x and y data. The average is a simple arithmetic average, which is defined as

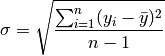
The standard deviation from the mean describes the scatter of the data set around the average (higher standard deviation means more scatter):
The spreadsheet supports cut/paste operations between CurveExpert and commercial spreadsheets and/or applications; this expedites the moving of data from a spreadsheet to CurveExpert, or from CurveExpert to the spreadsheet.
For best results, if you are pasting in an entire dataset into an empty spreadsheet, do not select any cells in the spreadsheet. Just selectEdit|Paste, and CurveExpert will read the clipboard data into the built-in spreadsheet.
Warning
Not following the rules above might result in an undesired (0,0) pair inserted at the end of your dataset, and this data point WILL affect any curve fit calculations. So, watch for this occurrence, after you finish entering data and/or pasting in data. If the (0,0) pair is there, simply click on its row header and choose Edit|Cut to get rid of the unwanted point.
CurveExpert features a built-in spreadsheet for editing your data. This spreadsheet strongly resembles commercial packages such as Excel in operation and in appearance. To edit a particular point, simply click in its cell; a black selection rectangle will appear along with a blinking caret. The data in the cell may then be edited. To select a range of data, click the left mouse button and drag the mouse until the desired data is highlighted.
The headings across the top of the spreadsheet indicate the type of data in each column. The “X” column denotes the independent variable, the “Y” column denotes the dependent variable, and the “STD” column (if present) contains standard deviation data for each data point. The row headings down the left side of the spreadsheet specify the data point number. To select the entire spreadsheet, click the button in the upper left corner. To select an entire row or column, click the row or column header, respectively. The horizontal and vertical scrollbars at the bottom and left side of the spreadsheet allow you to scroll to different areas of the spreadsheet, if necessary. To navigate within the spreadsheet, use the arrow keys. Pressing the TAB or ENTER keys will intelligently navigate the selector to the next position in the spreadsheet in a Z-pattern (across, then down). Holding SHIFT while pressing either the TAB or ENTER keys will navigate in exactly the opposite manner. Note that you may use the TAB or ENTER to add new points to the data set. To add a column, click on the empty column directly to the right of the rightmost column. To delete a column, select an entire column and pick “Cut” or “Clear” from the Edit menu. Note that column removal is only available if the data set still has a dependent and independent variable; likewise, column addition is only available if standard deviation data is not yet present. Addition of a data point to the data set is a simple as picking the row below the bottommost row in the data set. All of the operations in the Edit menu will operate on the current selection in the spreadsheet. A multi-level undo/redo allows you to remove editing mistakes from the data set. Undoable actions include replacing a data point, range clears, and range inserts. Any action that can be undone can also be redone.